So in this next entry in this series, I want to start to cover a topic that every nerdy SQL programmer is going to want to know. “How do I make a query faster?” If you have worked with relational databases, you know the simple answer is to… check the estimated query plan, run the query and look at the actual plan, and in many cases to be completely honest, add indexes.
Since baseball season is coming to a close, let’s say that batting .333 is a pretty good batting average, right? In Microsoft Fabric’s Data Warehouse engine, you don’t have actual query plans, and you don’t really have indexes (even if the scripting tools may tell you that you do).
What you do have (that I am blogging about today) is
As usual, I will be using SSMS to do this work, and in this case it is important because this is where the visual query plan tools we T-SQL programmers know and love are.
Quick, but true story
I love to generate SQL using metadata. Both the kind that comes from the INFORMATION_SCHEMA/system catalog views and tables I create to enhance that data. Mapping names, datatypes, etc. Well, a few weeks ago, I generated a query that did, well, bad performance things (not AI takes over the world bad of course.) I generated a join between two tables that looked like:
SELECTFROM Table1 JOIN Table2 ON Table1.Table1Key = Table1.Table1Keyl;
And the actual query has about 30 tables in it (I will building a fact table that was resolving dimensional keys), so it wasn’t quite so obvious. So as I am testing this query, it is running for hours. It was one of the largest queries I had ever built on my Fabric instance, and before I realize my mistake, I started to fear that the engine might choke on queries with lots of even simple joins. Then after a bit of digging, I realized I was doing a Cartesian product of a multi-million row table with several multi-million row tables.
So once I killed it (about an hour in), I started digging and noticed my mistake, but as I started poking around, I got interested in query tuning on my Fabric Data Warehouse (for hopefully obvious reasons).
A bit of setup
To demo query tuning tools, here are a couple of tables with a relationship between each. Note that I am not at all going to try to describe query tuning any code yet. At this point in the process my only serious goal is to find some of the tools that I can uses.
So I will create a Domain table with 5 rows, and then a table I called Action to represent some action. I padded it out 100 characters each so it would have substance and added 100000 rows.
CREATE TABLE Domain( DomainId int NOT NULL, GroupingValue varchar(10))INSERT INTO Domain(DomainId, GroupingValue)VALUES (1,'One'),(2,'Two'),(3,'Three'),(4,'Four'),(5,'Five');CREATE TABLE Action( ActionId int NOT NULL, DomainId int NOT NULL, Padding char(100) NOT NULL)INSERT INTO Action(ActionId, DomainId, Padding)SELECT value, (Value % 5) + 1, 'pad'FROM GENERATE_SERIES(0,99999); -- wanted row 1 to have domain 1
Query plans and stats tools:
When you have tuned a few queries in your life, you know that the third place to look at a slow query (after ensuring that it isn’t having concurrency related issues, and then looking for obvious issues in the code like I had), is in the query plan. Here in Fabric DW T-SQL, that is also true. While you will notice that plans are a lot more basic than in SQL Server, there are still query plans that you need to check out, even if the tools you have available are a bit less expansive than you are used to.
View the estimated plan graphically
first I want to start out looking at how SQL Server and Fabric DW compare with tools. When you need to see the estimated plan for a query, it works just as you have always known. For example, let’s check the plan on this query:
SELECT *FROM Action JOIN Domain ON Action.DomainId = Action.DomainId;
Click Ctrl+L in Management Studio (or hunt down the icon to get it going) and you get the following plan:

Now, of course you can see my mistake, so let me fix that and then look at the plan.
SELECT *FROM Action JOIN Domain ON Action.DomainId = Domain.DomainId;

That looks… kinda the same and in some ways, the “bad” query kind of looks better than the good query. the Clustered Index Scan was just 65% of the cost, but 79% in the second? If you look at the lines, the first line going into SELECT estimated 498695 rows, and the second 997. Both estimates are kind of interesting, as the first estimate was 500005, with was just a few thousand off, and the second returns 100001 rows, which is clearly a lot bigger than the approximately 1000 rows.
Ok, so put the two queries into a single batch and grab the plan.

Interesting that the much worse plan is just 55% of the time and the more reasonable one is just 45%. Which is to say that the query plan has, and always will be, just one part of the query tuning process.
The last thing I will note is that there are two very interesting things to me.
First, the columnstore Index referenced really not a columnstore structure. You will see that when you are scripting code too, where the tools try to generate a clustered index that doesn’t actually make sense for a Fabric DW.
The second is the Return (Move) operator (which the description says “returns results”). What this really does (along with what the compute scalars are all about I will leave this for a later edition once I have experienced and studied more about query tuning. I have guesses that I would toss out in a trivia contest, but I don’t know enough to try to make it sound like I do know what I am talking about.
So far, all the queries I have executed are quite fast (most less than 70 million rows or so).
Viewing the actual plan
Oddly, when I was doing this, I kind of didn’t expect that estimated plans would be available, but I was expecting that the actual plan would. If you turn on the Include Query Plan feature on SSMS or the Include Live Query statistics and execute the query:
SELECT *FROM Action JOIN Domain ON Action.DomainId = Domain.DomainId;
you will see the following error messages:
Framework Microsoft SqlClient Data Provider: Msg 15869, Level 16, State 2, Line 1STATISTICS is not supported for SET.Framework Microsoft SqlClient Data Provider: Msg 15869, Level 16, State 2, Line 1STATISTICS is not supported for SET.
Like a Sith or a Jedi, there are always 2.
Obviously a huge bummer, mostly because one of my favorite tools for performance tuning is SET STATISTICS IO and SET STATISTICS TIME. These two tell you so much about how the query processed in numbers that you can compare that don’t include idle time, just CPU and IO times. IO is the most important of theme all, since it tells you how many pages are read out of memory. You can see the effects of different algorithms and even reorganizing your table. With such a different platform being used here in T-SQL, it is very understandable, but hopefully this is high on the list.
In my next post I will cover where you can get some of the same information using the Query Insights features.
Client statistics
While the client statistics feature in SSMS is one of those I don’t use that often, it can be useful to see how much data you are transferring and how much time executions cost.
Client stats works! Shift=Alt S enables it. Then execute a query:
SELECT *FROM Action JOIN Domain ON Action.DomainId = Domain.DomainId;
Then as you execute code, you will see this come up after every execution:

Not as good as a an IO statistics, an actual query plan or the most wonderful live query stats feature. Hopefully some day.
Fetching plans in text
As much as any T-SQL programmer loves a graphical query plan to get an overview of the plan, they aren’t always the greatest thing when you are trying to share with coworkers/the internet when you need details (or you aren’t using SSMS or another tool that will give you the graphical plans). For example, in my previous example, you couldn’t see a lot of the detail in the image
Luckily you can fetch the plans using using the same settings as with SQL Server (admittedly I wouldn’t hate if we could get EXPLAIN statement modifier in both SQL Server and Fabric SQL.
SET SHOWPLAN_TEXT ON;GOSELECT *FROM Action JOIN Domain ON Action.DomainId = Domain.DomainId;GOSET SHOWPLAN_TEXT OFF;GO
The output here (presented with a little bit of formatting), is this:
  |--Compute Scalar(DEFINE:([wh_monitoring].[dbo].[Action].[ActionId]=[wh_monitoring].[dbo].[Action].[ActionId],
                           [wh_monitoring].[dbo].[Action].[DomainId]=[wh_monitoring].[dbo].[Action].[DomainId],
                           [wh_monitoring].[dbo].[Action].[Padding]=[wh_monitoring].[dbo].[Action].[Padding],
                           [wh_monitoring].[dbo].[Domain].[DomainId]=[wh_monitoring].[dbo].[Domain].[DomainId],
                           [wh_monitoring].[dbo].[Domain].[GroupingValue]=[wh_monitoring].[dbo].[Domain].[GroupingValue]))
       |--Compute To Control Node
            |--Hash Match(Inner Join, HASH:([wh_monitoring].[dbo].[Domain].[DomainId])=
                                                                         ([wh_monitoring].[dbo].[Action].[DomainId]))
                 |--Clustered Index Scan(OBJECT:([wh_monitoring].[dbo].[Domain].[ClusteredIndex]))
                 |--Clustered Index Scan(OBJECT:([wh_monitoring].[dbo].[Action].[ClusteredIndex]))
I love how looking at this you can see some of what work it had to do. You can see a bit more what the compute scalar was doing here, which is not something you would see in T-SQL. But let’s take a look a the “bad” query:
SET SHOWPLAN_TEXT ON;GOSELECT *FROM Action JOIN Domain ON Action.DomainId = Action.DomainId;GOSET SHOWPLAN_TEXT OFF;GO
Look at the text plan for this:
|--Compute Scalar(DEFINE:([wh_monitoring].[dbo].[Action].[ActionId]=[wh_monitoring].[dbo].[Action].[ActionId],
                            [wh_monitoring].[dbo].[Action].[DomainId]=[wh_monitoring].[dbo].[Action].[DomainId],
                            [wh_monitoring].[dbo].[Action].[Padding]=[wh_monitoring].[dbo].[Action].[Padding],
                            [wh_monitoring].[dbo].[Domain].[DomainId]=[wh_monitoring].[dbo].[Domain].[DomainId],
                            [wh_monitoring].[dbo].[Domain].[GroupingValue]=[wh_monitoring].[dbo].[Domain].[GroupingValue]))
       |--Compute To Control Node
            |--Hash Match(Inner Join, HASH:([Expr1004])=([Expr1005]), RESIDUAL:([Expr1004]=[Expr1005]))
                 |--Compute Scalar(DEFINE:([Expr1004]=(0)))
                 |    |--Clustered Index Scan(OBJECT:([wh_monitoring].[dbo].[Domain].[ClusteredIndex]))
                 |--Compute Scalar(DEFINE:([Expr1005]=(0)))
                      |--Clustered Index Scan(OBJECT:([wh_monitoring].[dbo].[Action].[ClusteredIndex]),
                         WHERE:([wh_monitoring].[dbo].[Action].[DomainId]=[wh_monitoring].[dbo].[Action].[DomainId]))
You can see it didn’t really join on the domain values, it joined on an expression it created. Ok, that is enough of that for now!
If you want to be able to view the plan in SSMS later, like if you aren’t using SSMS when you want to capture the plan, you can get the full detailed plan in XML format using:
SET SHOWPLAN_XML ON;GOSELECT *FROM Action JOIN Domain ON Action.DomainId = Domain.DomainId;GOSET SHOWPLAN_XML OFF;GO
The output is a much longer set of text that defines everything you can see in the graphical viewer. The value is that you get all the details (and if you save it as a .sqlplan file you can open it in SSMS as graphical, and in either case you can switch back and forth from the XML and the XML using this section:
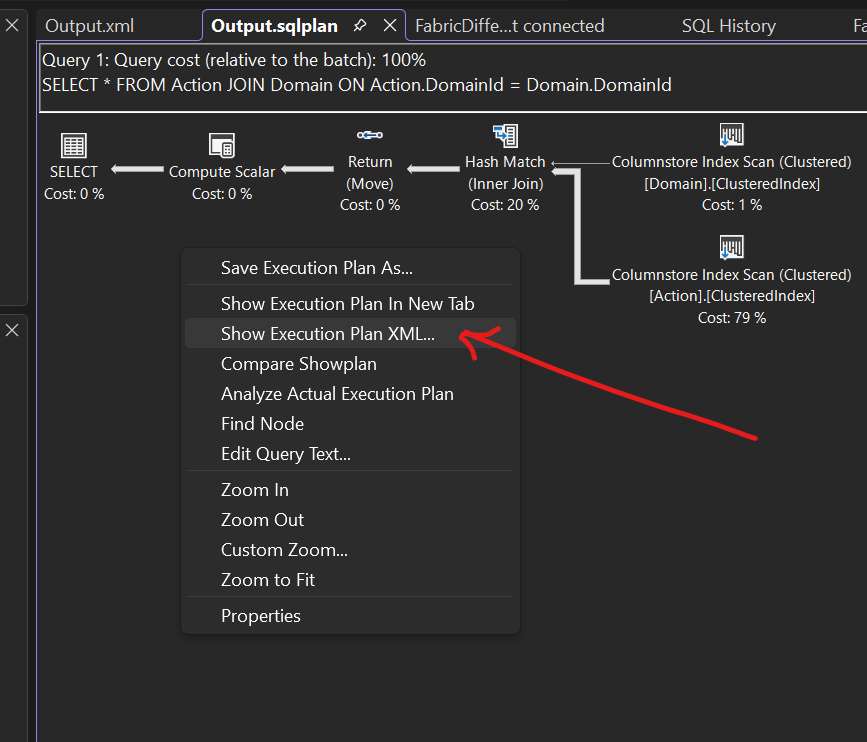
It can be really hard to view, but sometimes it is nice to be able to read the text of the plan all in one view (No doubt, all the XML formatting text gets it kind of messy.)
<StmtSimple StatementText="SELECT *FROM ActionJOIN Domain ON Action.DomainId = Domain.DomainId" StatementId="1" StatementCompId="1" StatementType="SELECT" RetrievedFromCache="false" StatementSubTreeCost="0.279516" StatementEstRows="99739" SecurityPolicyApplied="false" StatementOptmLevel="FULL" QueryHash="0x652CA2CE27C61B0F" QueryPlanHash="0x196A8732BBC6C68F" CardinalityEstimationModelVersion="160">
But nice to see the plans and costs estimates in here if you want to scan the details with tool tips.
Summary
T-SQL in a Fabric Data Warehouse shares a lot of similarities with it’s SQL Server cousin in ways that make it a wonderful, familiar experience using. It also can be might annoying when you really want to see those details you have grown to lean on for various purposes.
In the next few entries in the series, I will cover more about getting and affecting performance of your T-SQL queries in Microsoft Fabric.




Leave a Reply